SOLUTIONS / OKKHI ANALYTICS
Okkhi Analytics
The floor, understood in numbers.
Business and operations intelligence built on the same on-premise vision runtime — traffic, inventory, customer behavior, and service quality, all measured automatically from the cameras and audio you already have. No dashboards to babysit, no manual counts.
RETAIL / SHOWROOM / BRANCH · EDGE GPU · ON-PREMISE ONLY
Capabilities
Measured automatically, not estimated manually.
Traffic, service quality, inventory movement, and customer behaviour — read continuously from cameras you already run, with no badges, sensors, or manual tallies.
 ANL-01
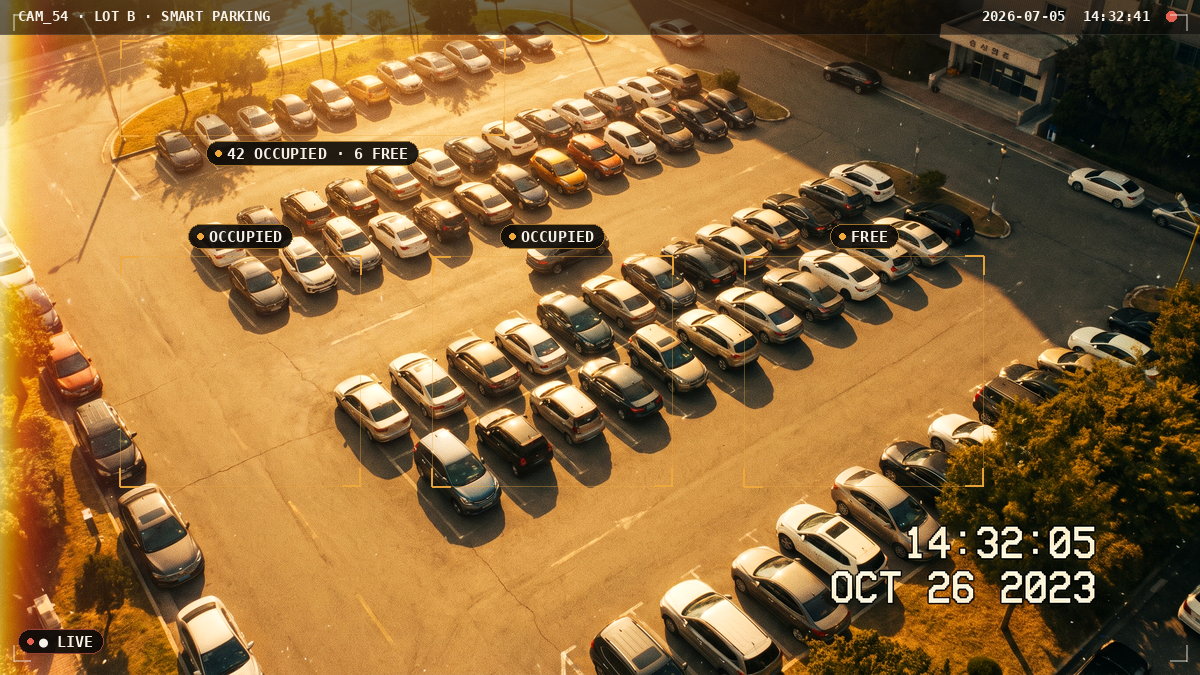
Smart Parking
Per-stall occupancy from ordinary cameras — utilization dashboards without ground sensors.
 ANL-02
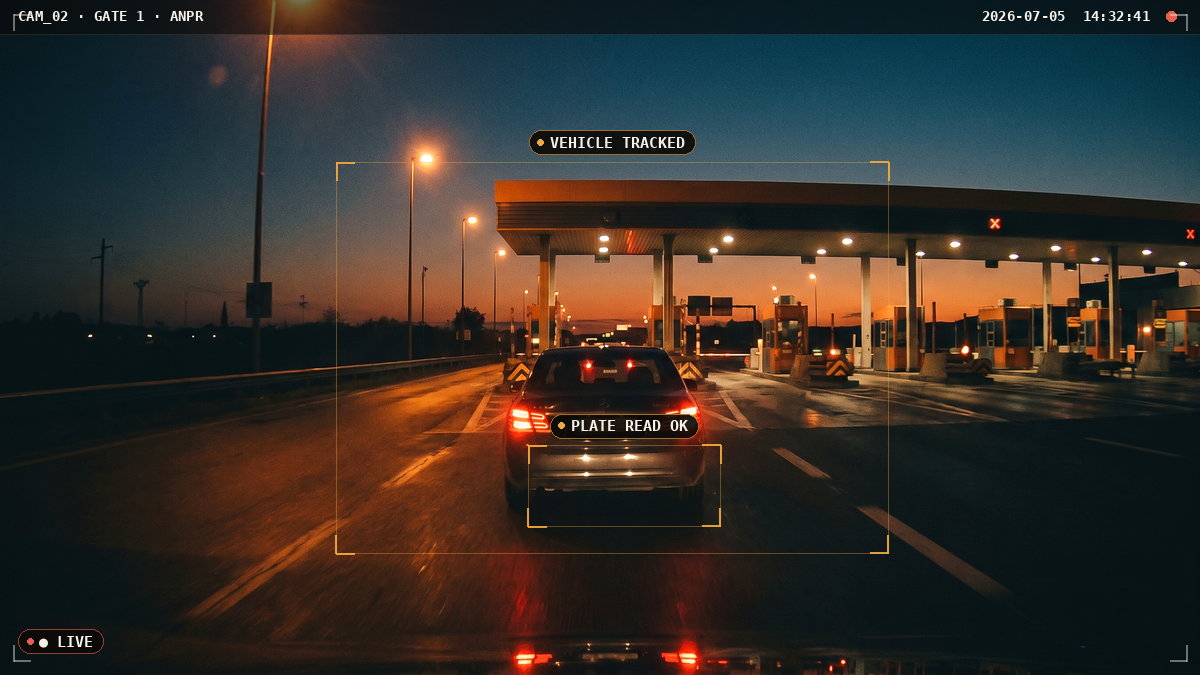
Number Plate Recognition
Dual-script plate reading — Bangla and English — with entry/exit deduplication and gate integration.
 ANL-09
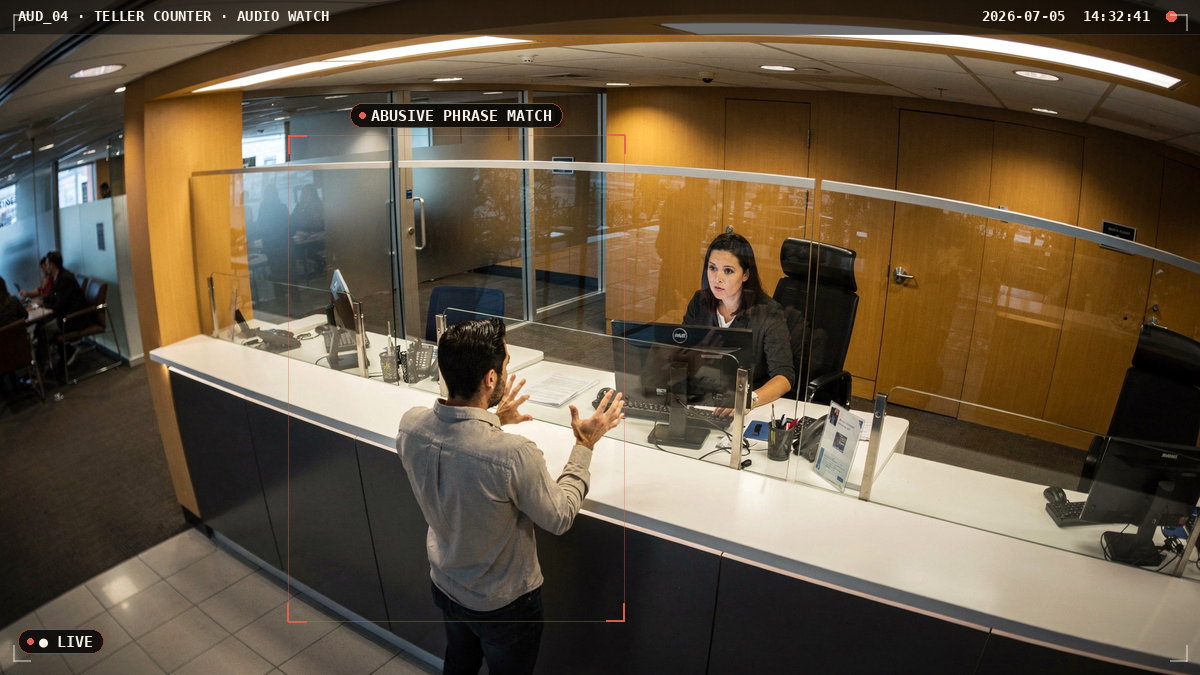
Abusive Language Detection
Listens for abusive or threatening language at ATMs, counters, and call centers — and alerts while the interaction is still happening.
 ANL-03
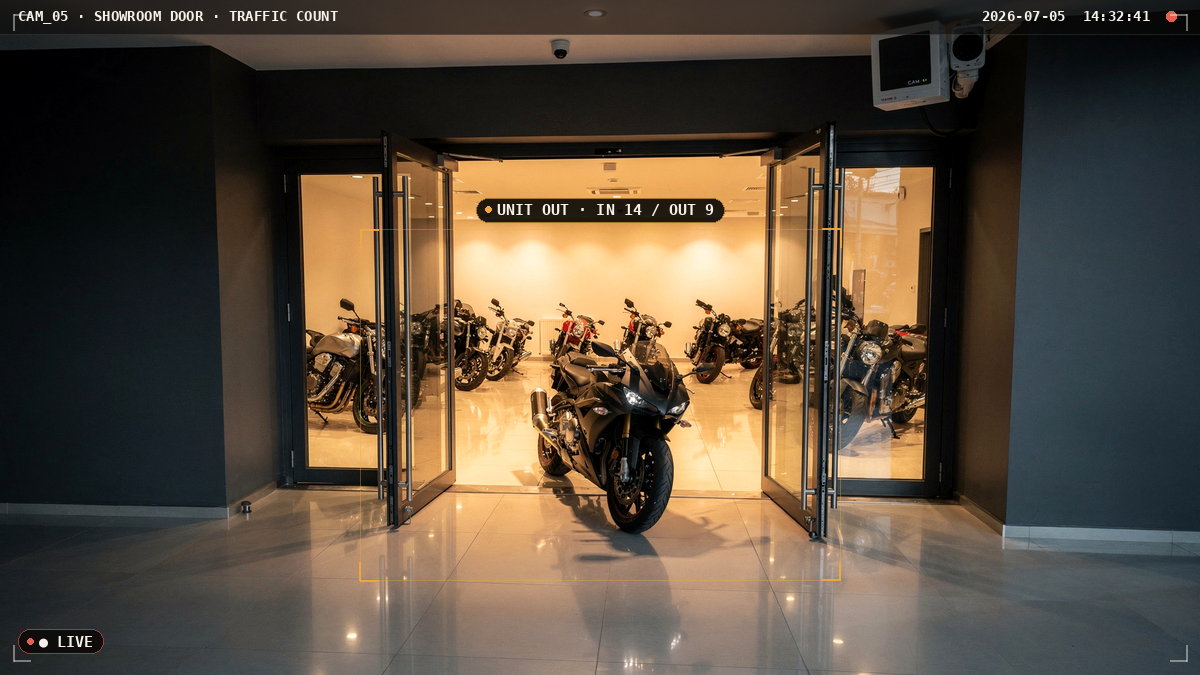
Vehicle & Product Traffic Counting
Counts vehicles and large products moving in and out of a showroom floor — separate from foot traffic, and just as precise.
 ANL-04
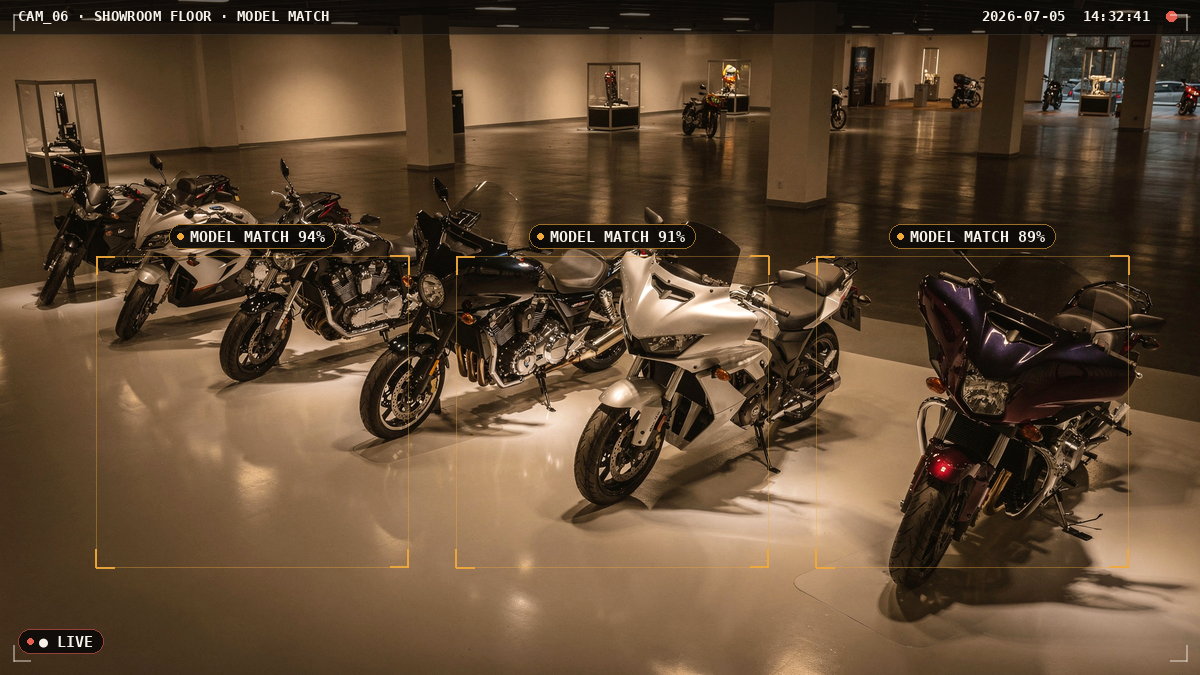
Product & Model Recognition
Identifies exactly which product model is on the floor or in front of a customer, matched against your own catalog.
 ANL-05
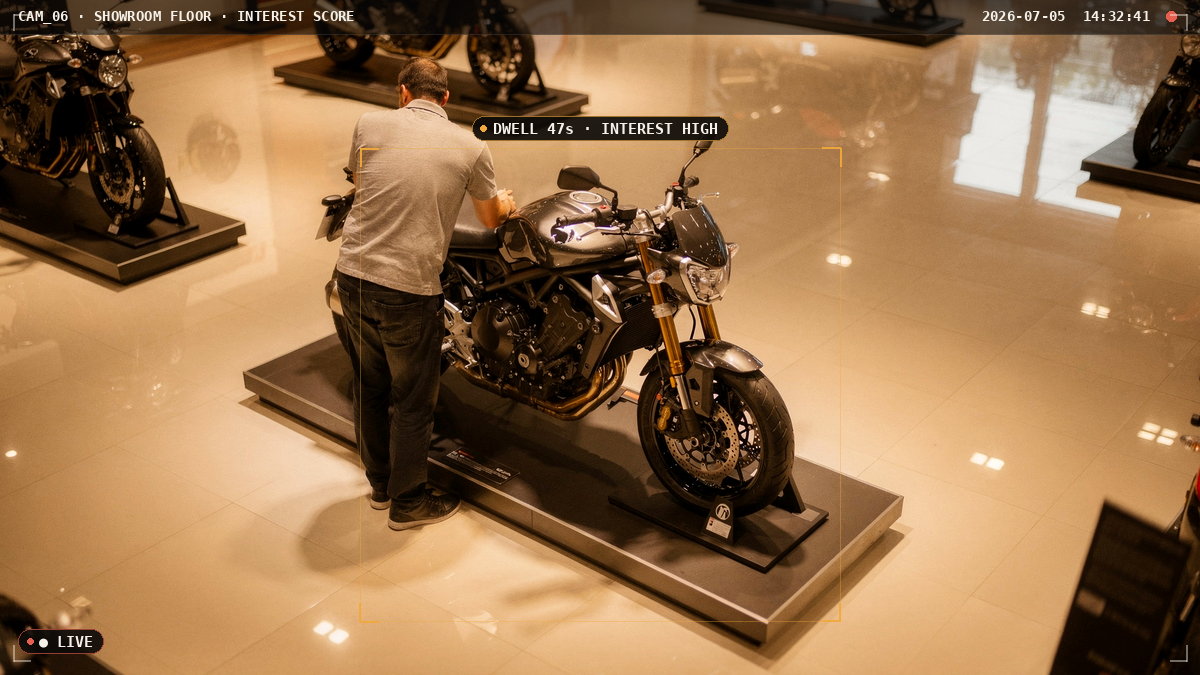
Product Interest Analytics
Measures how long customers actually spend with each product — real interest, not foot traffic guesses.
 ANL-06
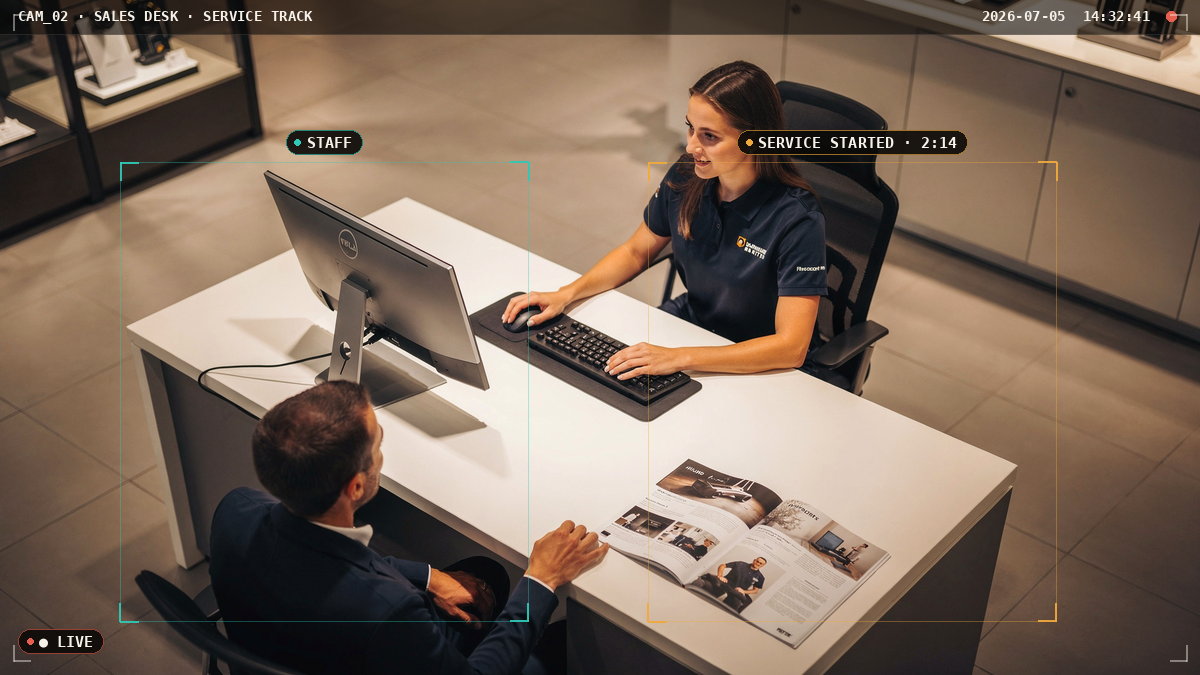
Service Interaction & Time-to-Serve
Detects the moment a staff member starts serving a customer and times the interaction automatically.
 ANL-07
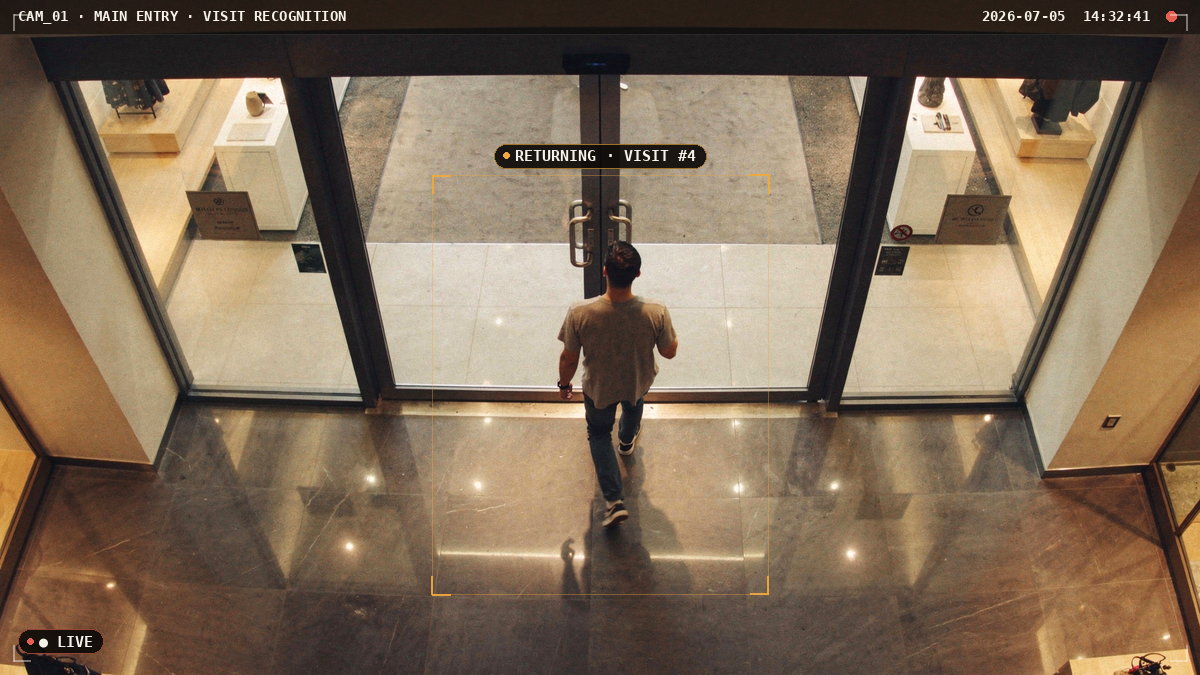
Repeat Customer Recognition
Recognizes a returning customer across visits — entirely on-premise, with no identity ever leaving your building.
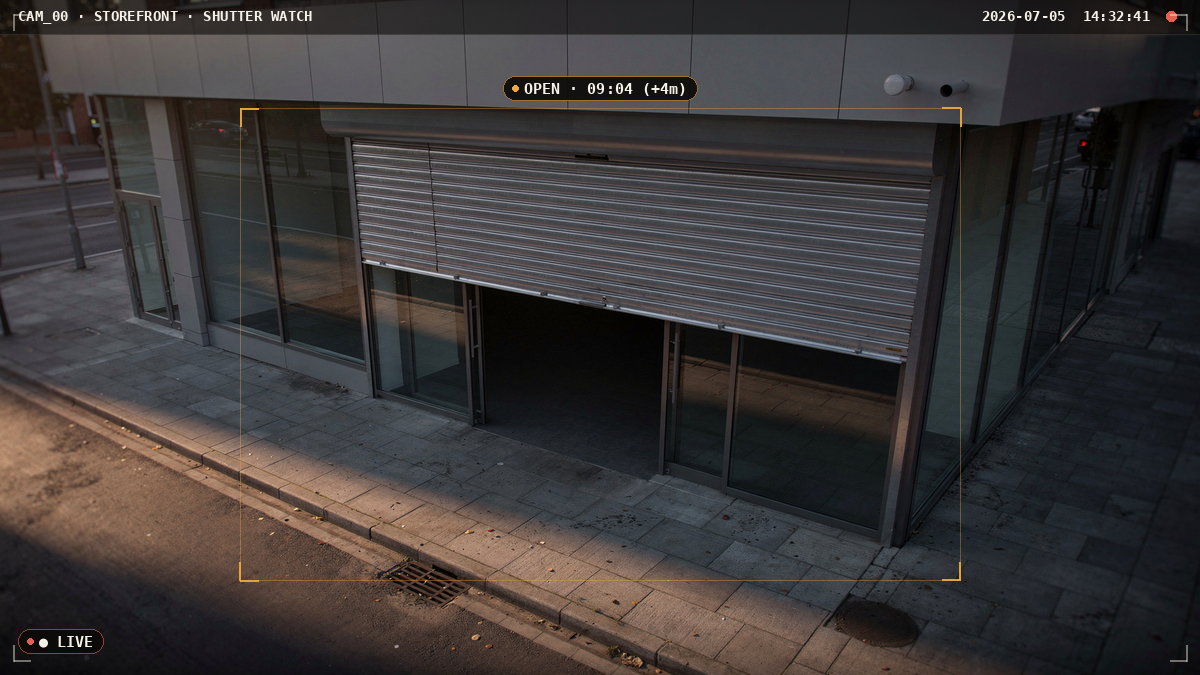 ANL-08
Store Hours & Shutter Compliance
Confirms the shutter opened and closed on schedule — an operations check that usually only happens when something's already wrong.
Don't see your exact use case here?
Most of these started as a customer asking for something that wasn't on the list. Describe the problem and we'll tell you honestly whether vision AI is the right tool for it.
Why teams choose it
Numbers you can manage on.
No new hardware
No floor sensors, no beacons, no counting clickers. The cameras on your ceiling become the measurement layer.
Anonymous by default
Footfall, dwell, and service metrics work without identifying anyone. Where recognition is used, it stays entirely on-premise.
Continuous, not sampled
Every hour of every day is measured, so decisions rest on the whole picture rather than a one-week manual study.
Exports to your stack
Dashboards, CSV, and webhooks feed whatever BI or ERP system you already report from.
How a deployment runs
From first call to live system.
Objective setting
We start from the decision you want to make — staffing, layout, stock — and work back to the metric that answers it.
Zone mapping
Entrances, desks, and display areas are mapped per camera so counts attach to places that mean something to your team.
Baseline period
The system runs to establish your normal ranges before anyone is asked to act on a number.
Reporting handover
Dashboards and scheduled exports are wired to the people who own the decision.